How to improve your data-driven decision making
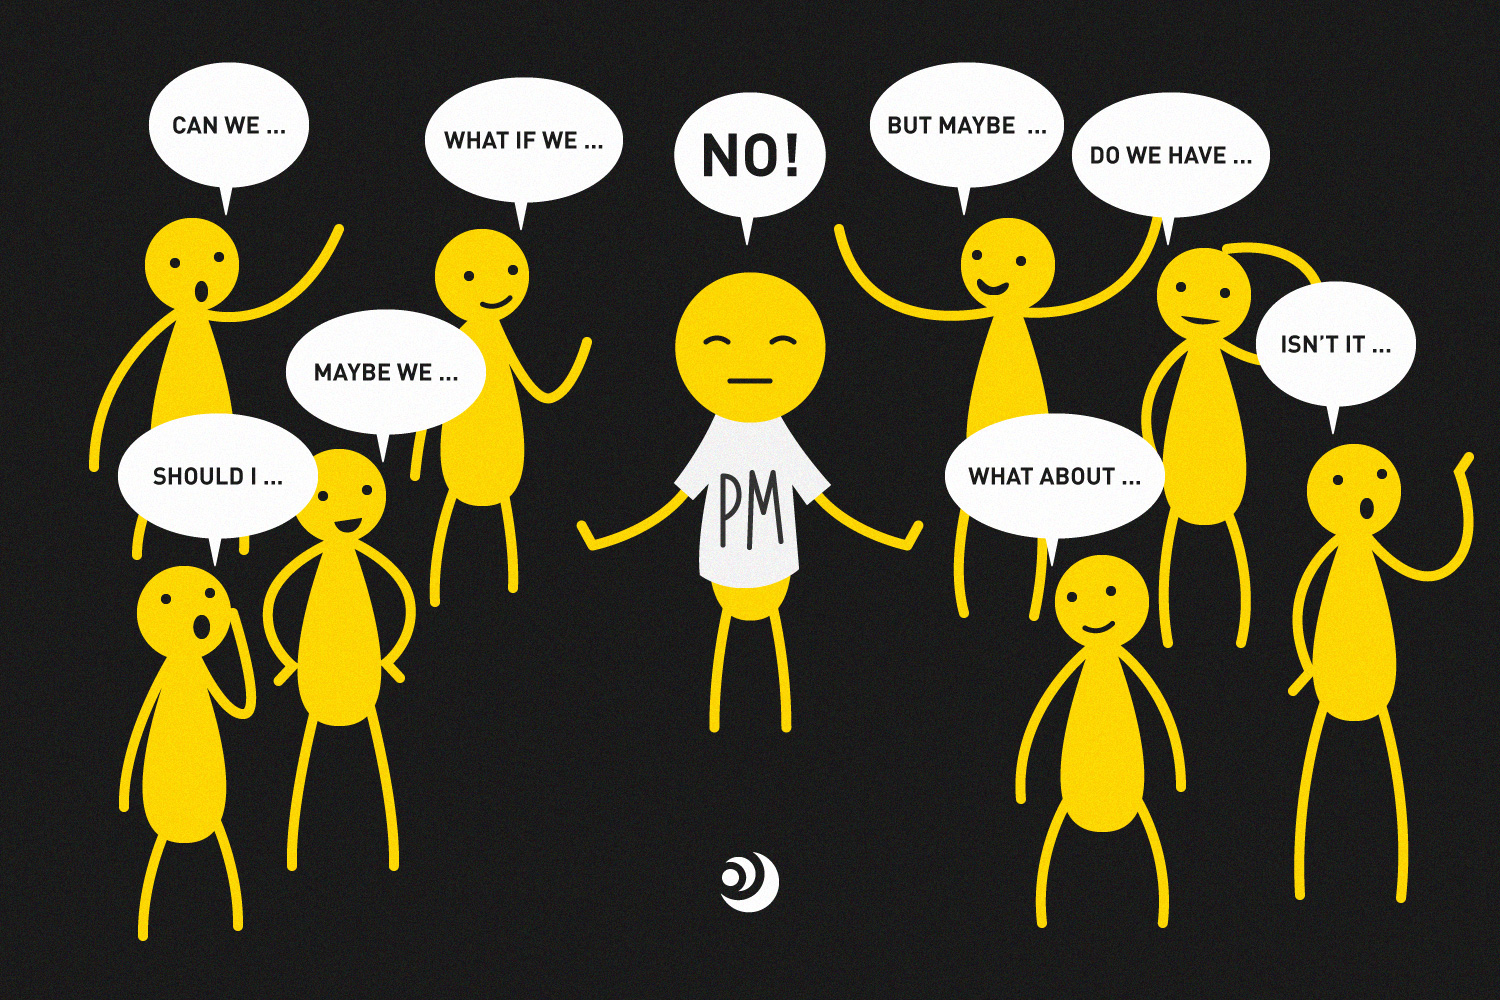
As a product manager here at Mooncascade, the unhappiest clients I see are the ones who find out that they didn’t need the feature they asked us to build or that it wasn’t worth their time. This usually stems from product managers not being able to use a data-driven decision making process, and instead being under pressure to prioritize the requests of different stakeholders, who each see their items as being most urgent without necessarily proving why they need to be accomplished first.
My advice: let data-driven decision making create your roadmap for feature prioritization. Confirm you’re on the right track by performing a simple cost-benefit analysis for your biggest feature requests. Estimating ROI for a feature can be done in a few easy steps that will help you make your final decision based on data. And it’s very hard for stakeholders to argue with data.
Here are the 5 steps of a data-driven decision making process for feature prioritization:
- Validate the pain
- Validate the solution
- Calculate the benefits
- Calculate the costs
- Prioritize based on ROI
1. Validate the pain
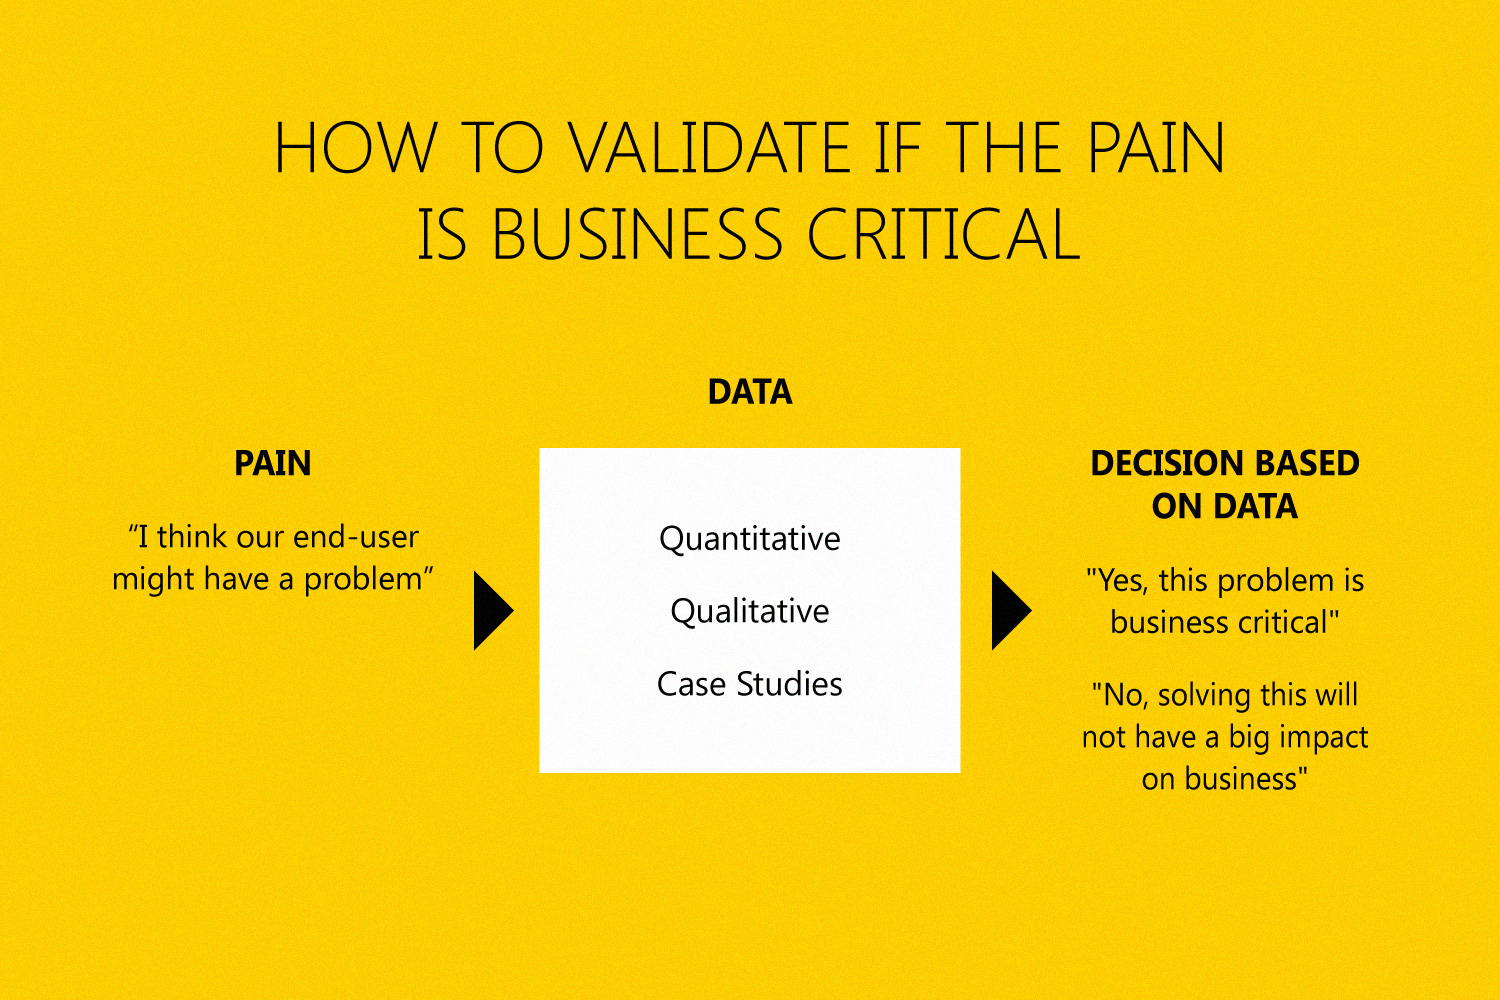
The fact that stakeholders or product managers feel that their end users are having a problem doesn’t necessarily mean the problem is impactful. Stakeholders only see their side of the product and product managers find a lot of edge case problems by extensively testing each flow in their user journey. You need to find out if you’re working on a hunch, or if you’ve found a real end-user pain that really needs to be solved. The best way to do that? Data-driven decision making – go back to what the numbers say and see if the problem really is as impactful as those who’ve had it will tell you.
There are three great ways that data-driven decision making can prove whether or not the pain you’re dealing with is impactful.
Quantitative data
You should start your data-driven decision making process by looking at quantitative data. Quantitative data never answers why pain exists, but it does give you an idea of where the problem is. For a digital product, you could use a tool like Google Analytics. Big drop-offs in your conversion funnel should definitely ring alarm bells.
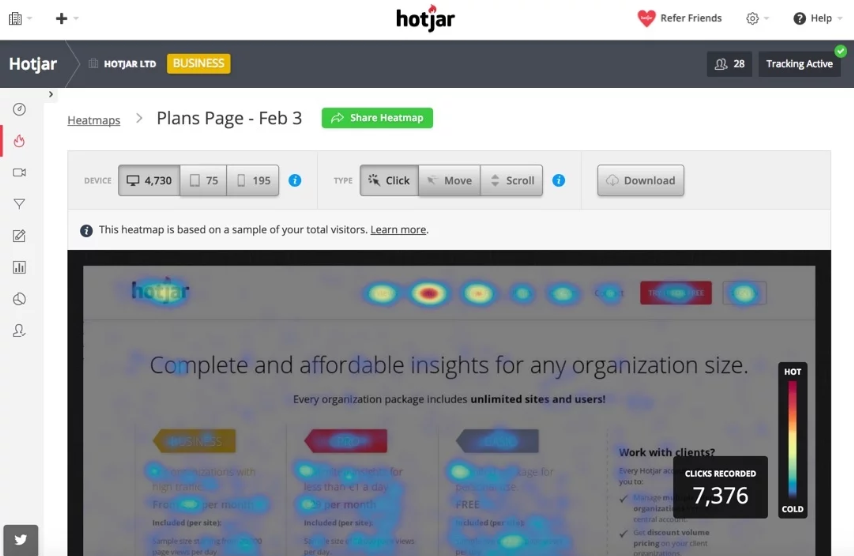
Another great option is a session recording tool like Hotjar. Heatmaps and recordings will help your data-driven decision making process by showing if your users aren’t clicking where you want them to or seem confused by important steps.
Any bulk data you have on hand might help you out too, whether it’s low sales in a product category, huge numbers in customer service about a certain topic, or a consistently bad NPS result – it’s all information that can be used as part of a data-driven decision making process.
Qualitative data
The next step in a data-driven decision making process is to look at qualitative data. It’s easiest to look at data you already have, like customer service reports or NPS feedback. See if the problems customers are having overlap with the pain you plan on solving. But always be sure the results are relevant to the issue at hand. Let’s say you’re thinking of adding delivery time and cost info to your e-commerce product page. When looking at questions the customer service department receives you’ll see that not all delivery topics are relevant to you. Questions like “what is the status of my delivery” are not relevant, but a question like “how fast is the delivery” indicates that users are not getting enough information from the product page.
to understand the quantitative data so you could prioritize your features better.
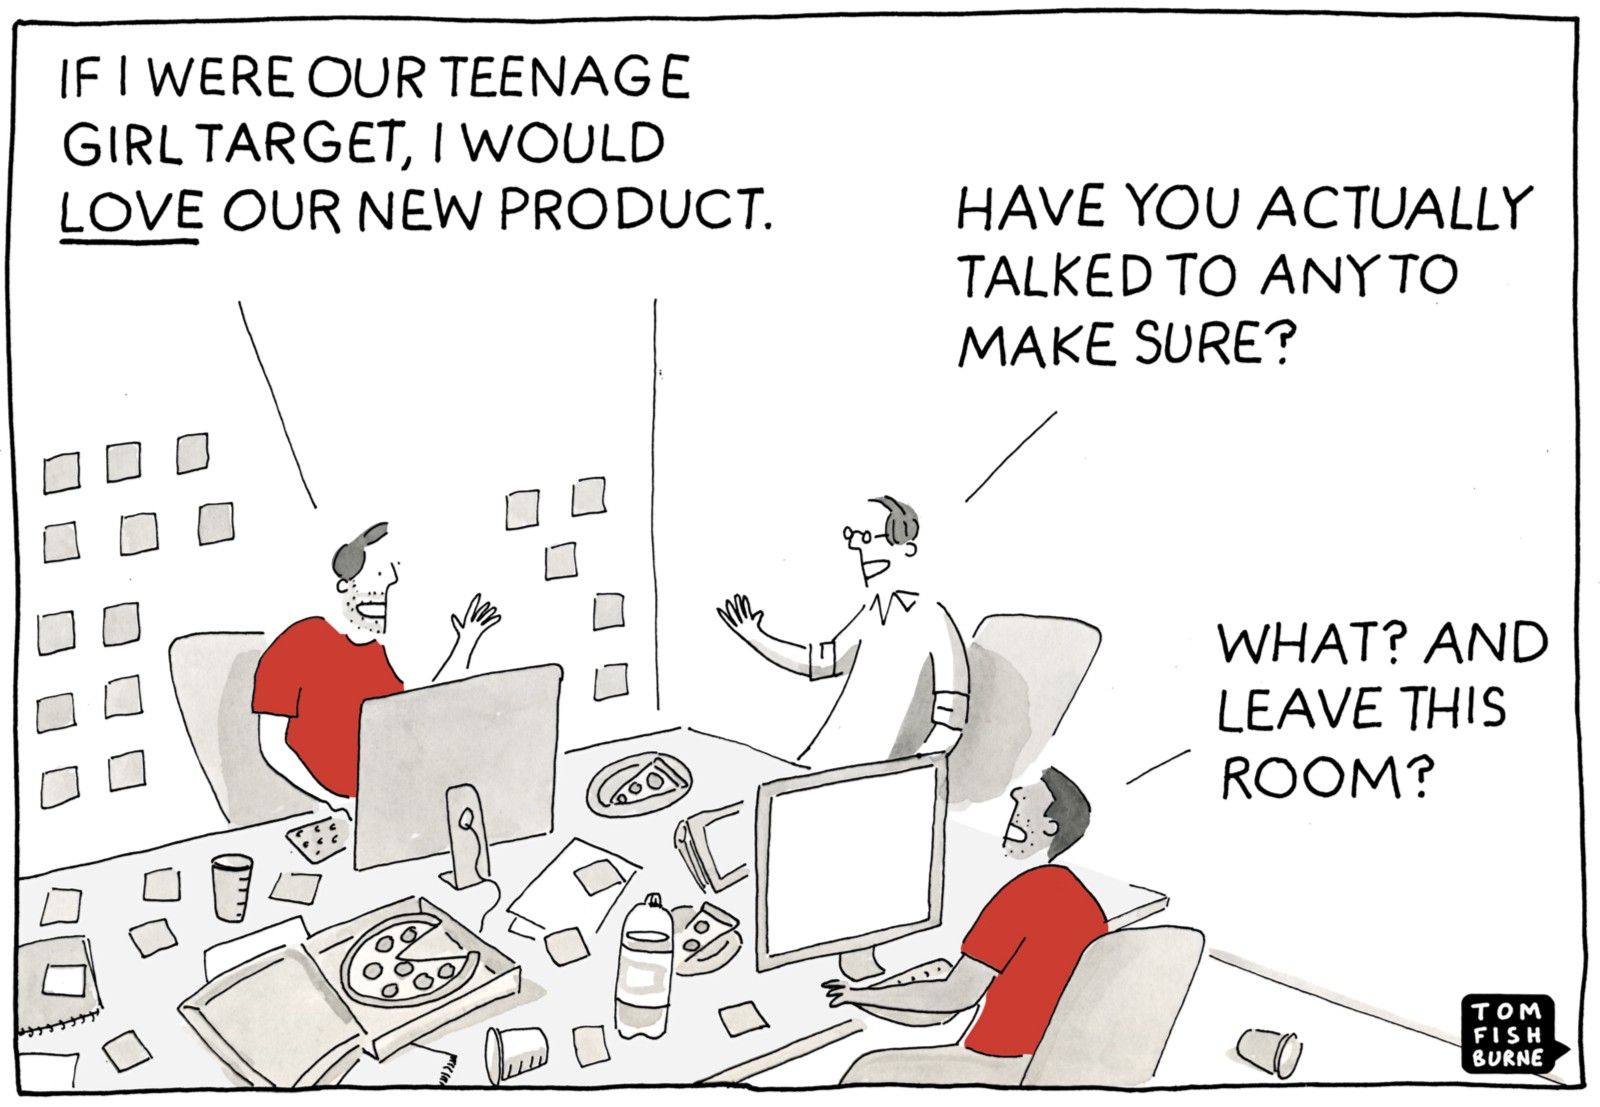
Another qualitative data source we like to use for data-driven decision making at Mooncascade is user testing. At this stage in the process, testing shouldn’t be expensive, extensive, or time-consuming. The entire point of this analysis is to find out if you should invest in your topic, so there’s no point investing before you’re sure. The easiest solution is to find up to five people in your target segment, and just talk to them! See if they find the problem without you pointing it out.
Case studies and reports
Another way you can practice data-driven decision making is by finding out if others have the same problem. This can give you a set of objective numbers to work with. Let’s use the same example of adding delivery info to your product page. You can find plenty of research on the subject, including numbers indicating how impactful such a feature could potentially be. This research is great for facilitating data-driven decision making, but it could be very costly to do on your own, so why not learn from others?
2. Validate the solution
Now that data-driven decision making has helped you determine that there is in fact an impactful end-user pain to be solved, it’s time for data-driven decision making to validate the solution. Sometimes the solution is obvious, but there can be many different ways to integrate a new feature into your user experience. So you want to be sure your solution will be found by your users.
I recommend doing some more simple user testing. Remember – no investment yet! You can start as simply as using Paint to put together a sketch of your idea and see what people think of it. You can even make a clickable prototype in five minutes using PowerPoint or KeyNote. Then you can show the solution to the same users you validated the problem with and a few more who aren’t aware of it. See if they find your solution easy to use.
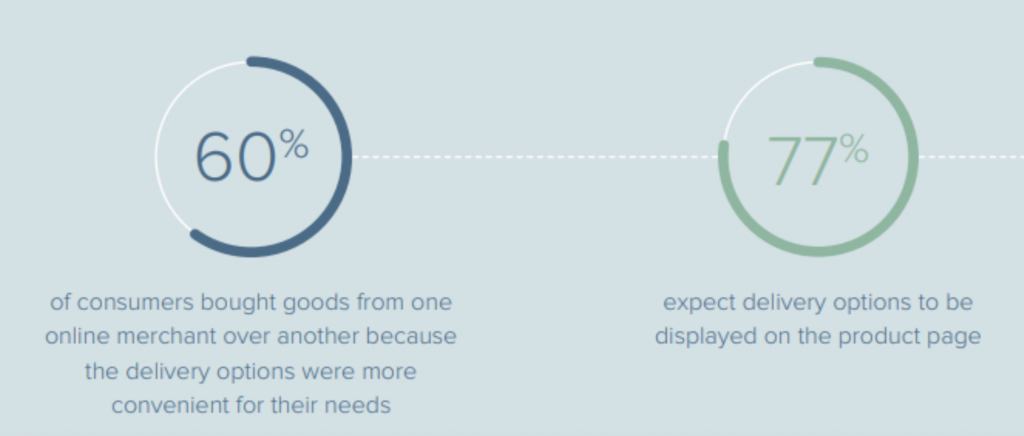
Another helpful source will be case studies and reports. Be sure to understand the difference between numbers that validate your solution versus numbers that validate the pain. For our example about delivery info, see example from the MetaPack 2017 State of eCommerce Delivery Consumer Research report below.
The first number shows you how many users consider the delivery to be important, which validates the end-user pain. The second number shows how many users expected a specific solution.
3. Calculate the benefits
The next step in our data-driven decision making process for feature prioritization is to calculate your feature’s benefits. To do this, figure out your product’s current situation and lay out the results you’d like to impact. This could be based on the data you collected in step one, like issues with drop-offs or conversion rates, for example. Find out which KPIs you’re trying to affect and how much they could be improved. Plot out a better situation. Ideally one of the KPIs will be increased revenue or decreased cost, so that you can calculate your feature’s monetary value.
Some guesswork will have to come in here regarding how much the KPI value will increase. In best-case scenarios, external data will guide your way: case studies, reports, internal examples of a similar problem being solved, even examples from a competitor. Try putting together a projection that’s as real and objective as possible. If it’s not too costly or time consuming, A/B test your solution. This will give you real numbers regarding how much your KPI values can increase – and ‘real numbers’ means more data to fuel your data-driven decision making process!
4. Calculate the cost
But if done early and properly, it’ll help you avoid throwing money out of the window.
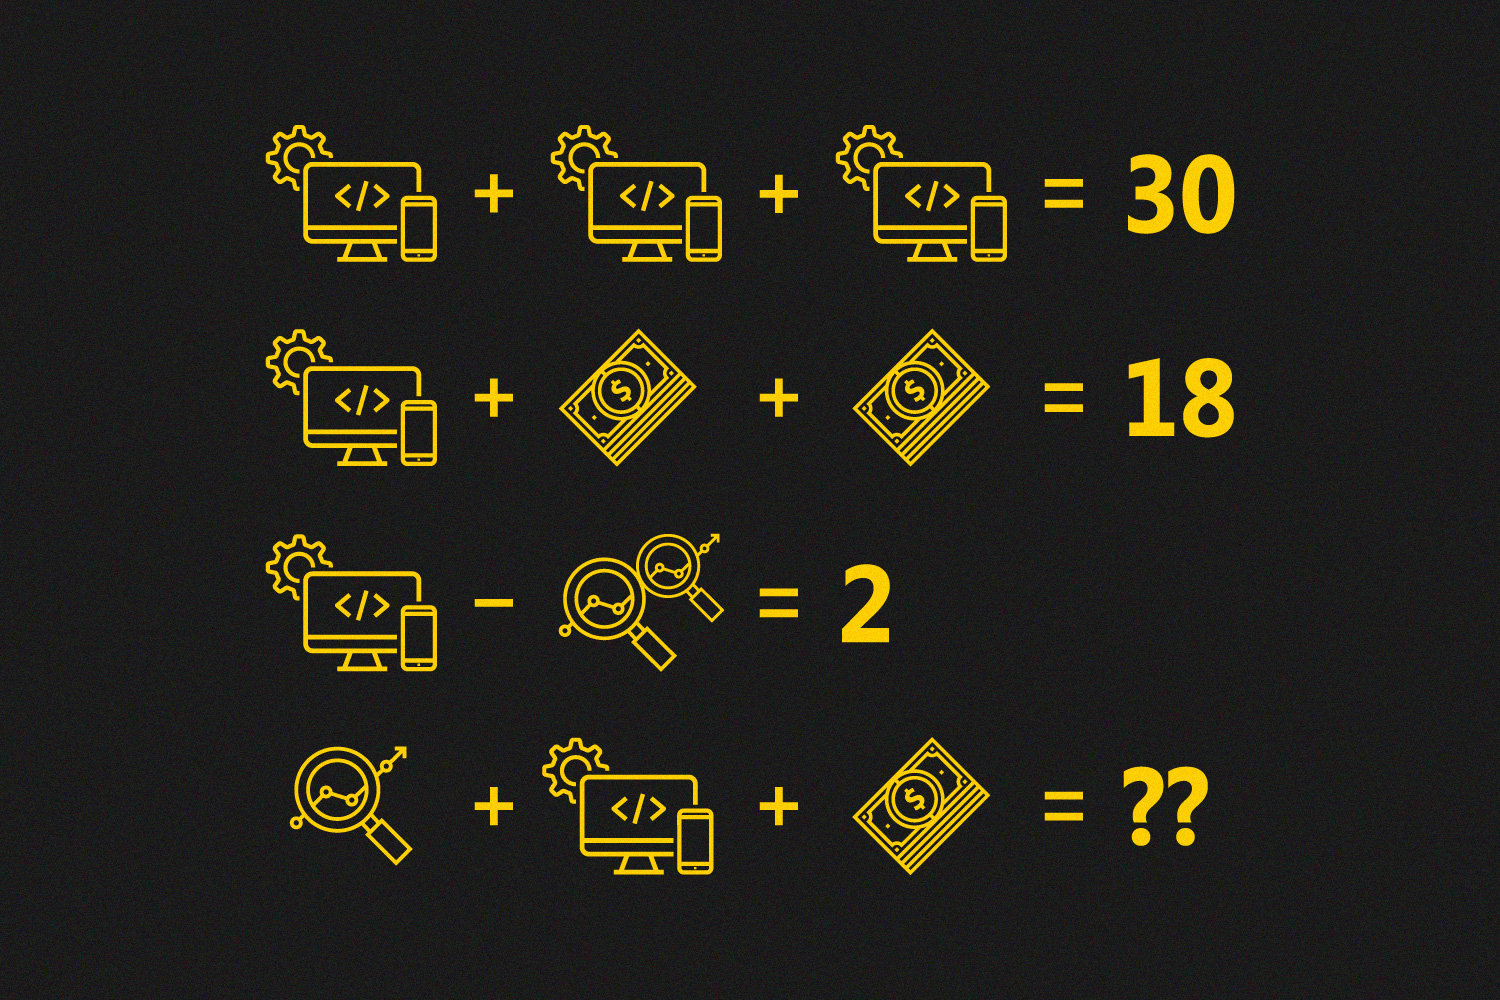
This is where the development team comes in. Break down the feature with your team to see how you could build a minimal version of it. Don’t forget to budget in time for testing, meetings and communication alongside software development. One meeting with four people means four hours of time billed. This is not insignificant. I always recommend adding an additional 30% of buffer in the budget—best to be surprised by a low cost than a high one. After calculating direct costs, think of indirect costs. How will your customer support team be affected? If you’re integrating new features into your system, what about maintenance cost increases?
Breaking down features and products into development tasks and estimating time is tricky. But if done early and properly, it’ll help you avoid throwing money out of the window. This is a skill our team at Mooncascade has developed well through our work with many different products and projects, so we now offer MVP workshops as a service. A proper MVP workshop will give you a technical roadmap that helps you plan out both time and expenses. This is especially recommended for new products, as there are often no technical requirements for getting started, though anyone who needs to plan a larger software development project is welcome to contact us.
5. Make your feature prioritizations based on ROI
Once you’ve validated the pain, proposed a solution, and performed a simple cost-benefit analysis, it’s time to calculate ROI (return on investment).
ROI will be the metric that you prioritize your ideas against. I like doing this simple ROI calculation: I divide the total cost of development by monthly impact on the bottom line. This will show you how many months need to pass to make the feature profitable.
After having calculated that metric, feature prioritization is easy. If you have two solutions, one that generates profit in six months, and one immediately, you should opt for the one that generates profit immediately. If you see that the timeframe is very long, say more than a year, you’d have to consider whether or not your idea would still be relevant once that timeframe had passed.
The secret to worthwhile investments? Data-driven decision making.
Handling feature requests is all about smart, data-driven decision making. Find proof that the pain exists. Find proof that your solution can fix it. Then lay out the costs and benefits of doing so, without spending too much time or too many resources getting the answers you need.
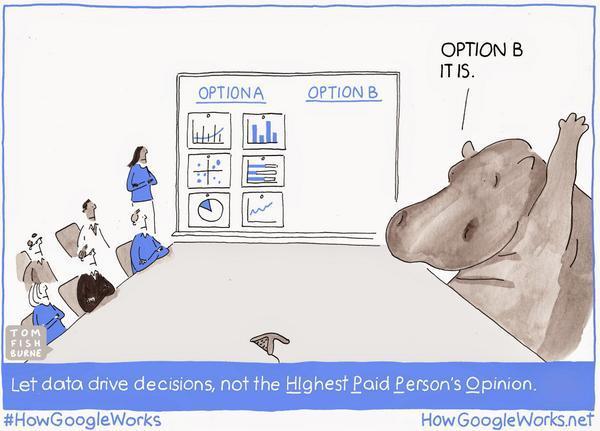
Once you’ve plotted this out, you can prioritize your ideas based on the numbers, and build a feature that not only works for the customer, but yields great results for your business, too. Providing these kinds of facts to stakeholders will ensure that no HIPPOs (Highest Paid Person’s Opinions) walk all over your carefully made roadmap.
Mooncascade
If you’re struggling with feature prioritization in your projects and would like to have a look at your business case through a fresh pair of eyes, Mooncascade is here to help. As an experienced product development partner, helping our clients to set a focus and avoid spending unnecessary time and money, is something we’re good at.


